

Temporal Stability of Psychometric Instruments

 Team Management Profile
 QO2 Profile
TMS Research Paper — Examining the test-retest reliability of TMS psychometric instruments
By Dr Dick McCann One important measure of reliability for psychometric instruments is that of temporal stability, often known as ‘test-retest’. For an instrument to be useful, it is important for it to have a reasonable level of temporal stability that can be related to the defining measures of the constructs.
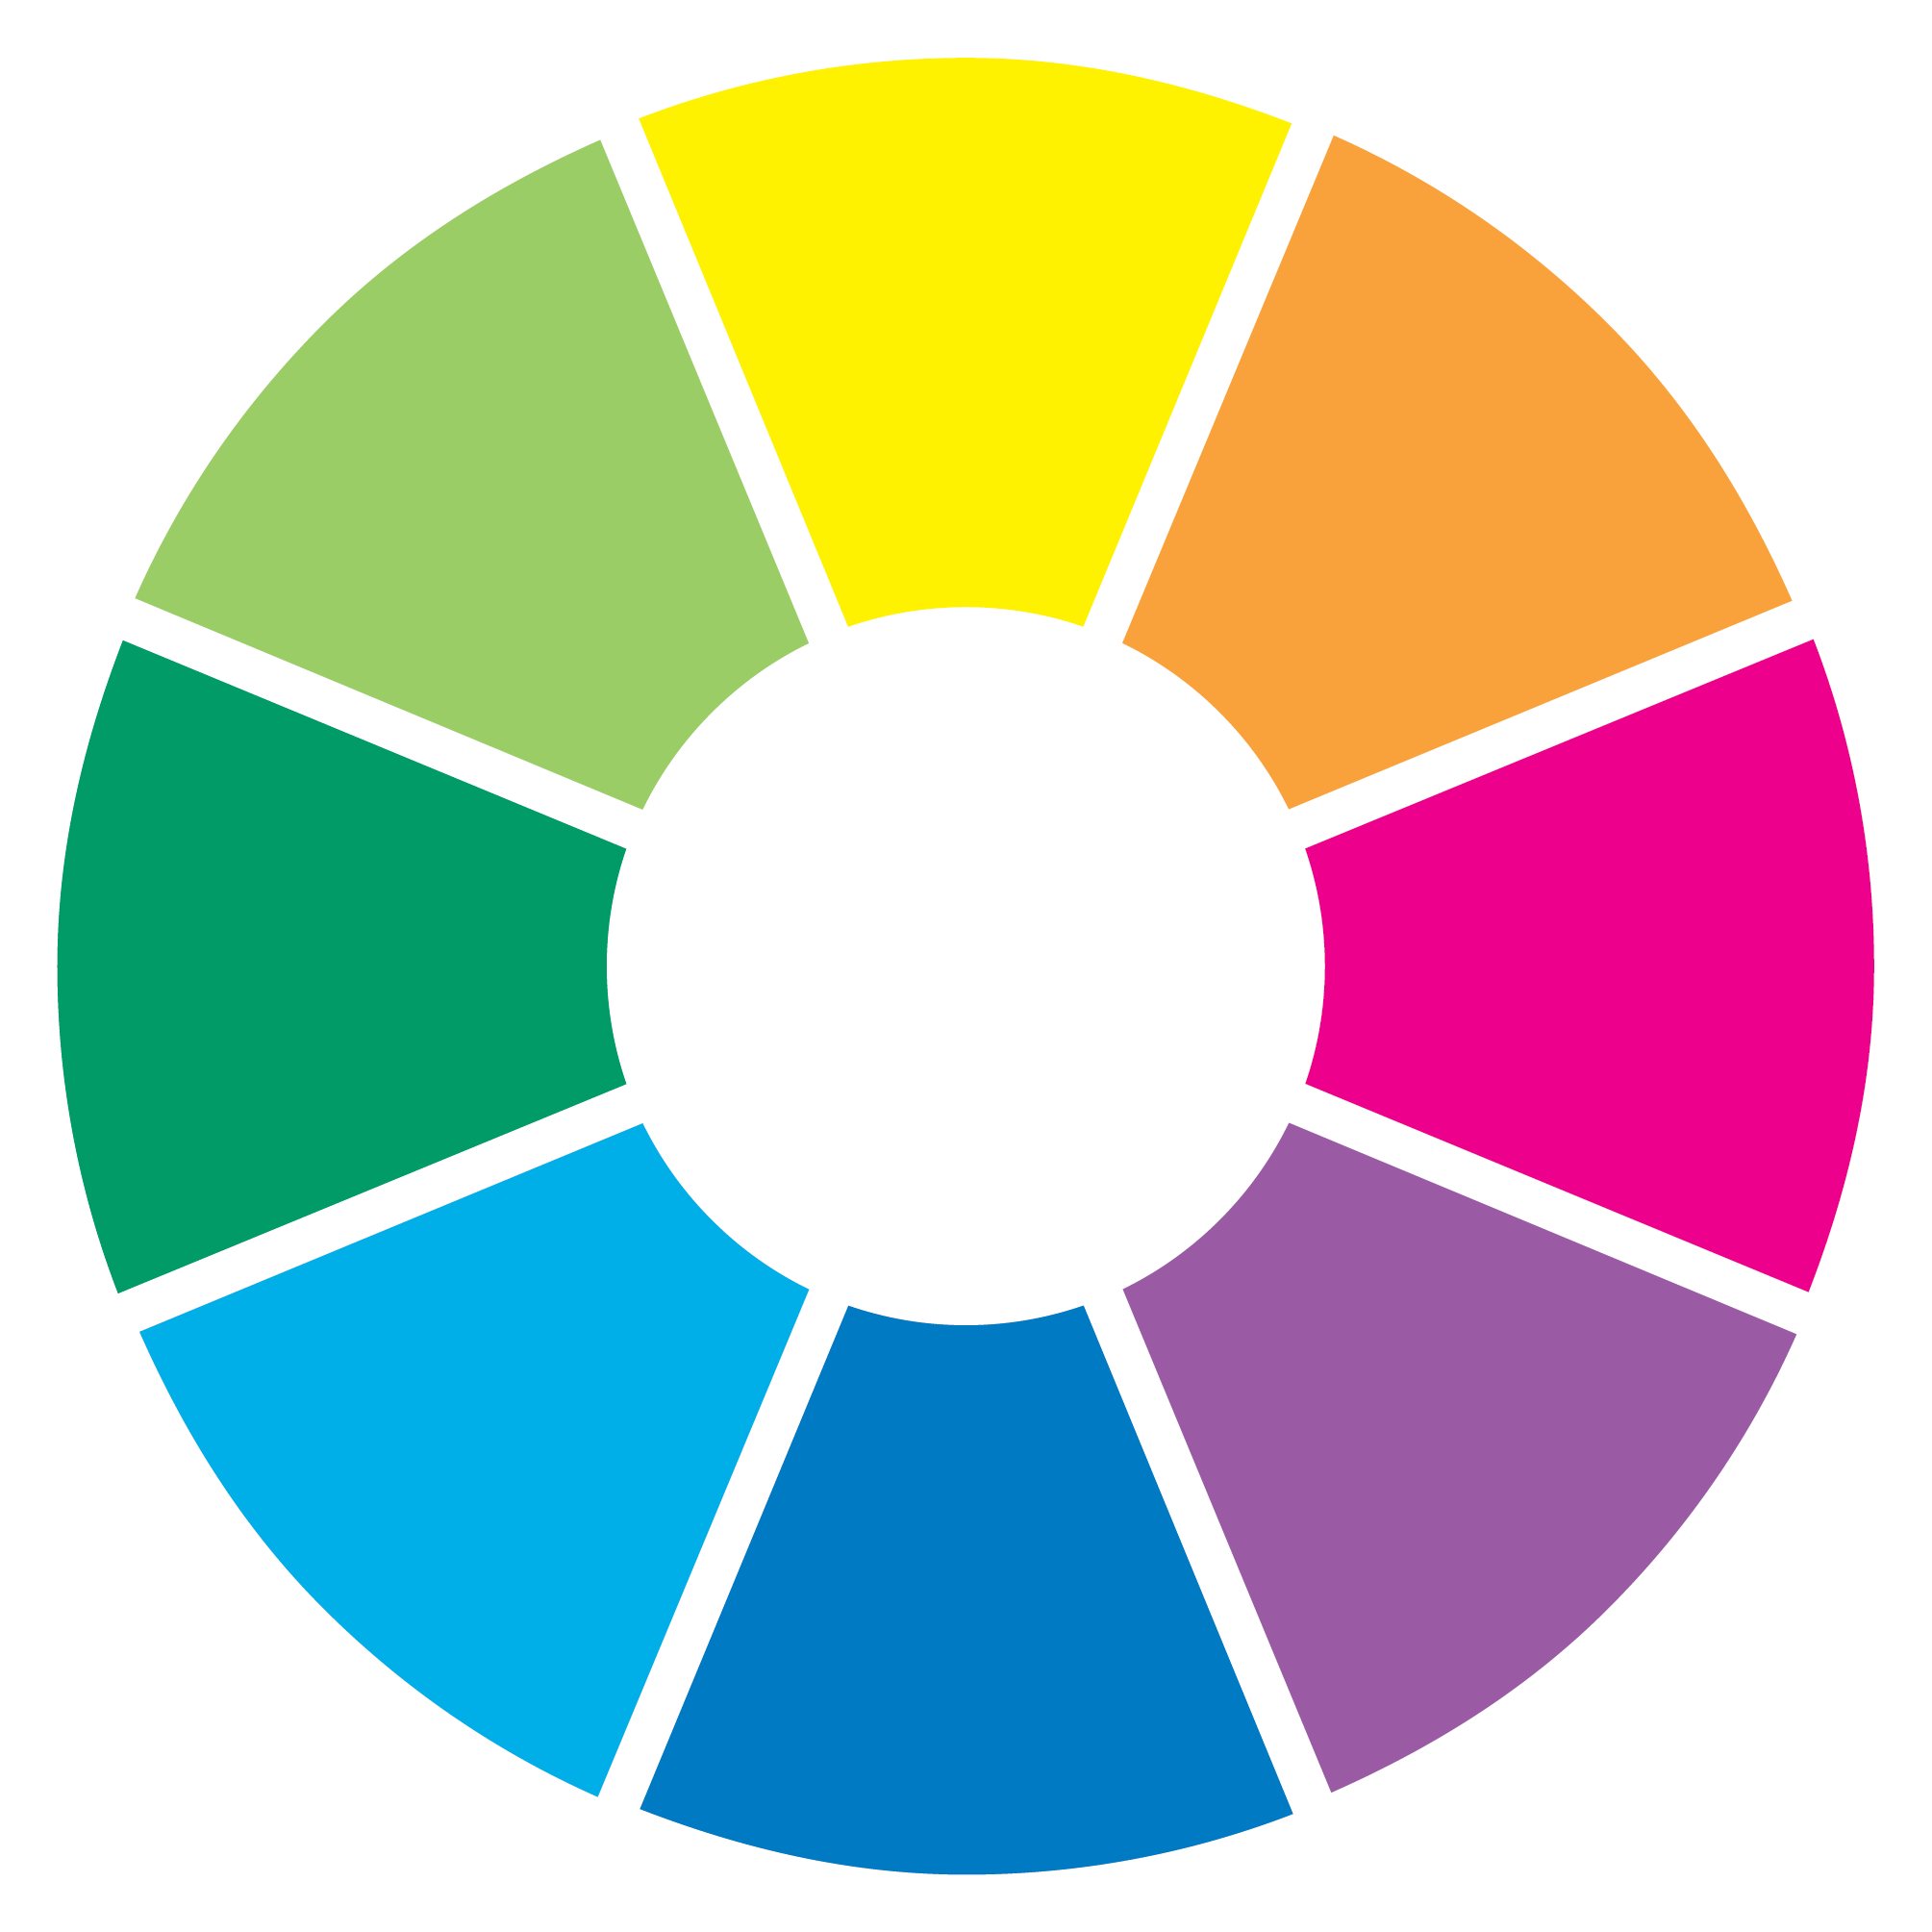
The Team Management Profile Questionnaire
Consider the Margerison–McCann Team Management Profile (TMP), which determines a person’s team role preference and reports it as a location on the Team Management Wheel. The instrument measures people’s responses across four work preference scales. If a respondent scored strongly as an extrovert on a particular day and then, say, two weeks later scored strongly as an introvert we may begin to question whether this instrument is measuring anything useful. That is why all instrument designers should publish their test-retest data so that users know the level of stability they can rely on. ‘Test-retest’ involves administering the same test to people over a time span. Intervals can vary from a short-term interval of, say, two to four weeks to longer-term ones of several months or years. Test-retest reliability can tap sources of error external to the actual instrument. Issues such as mood swings, health, motivational factors and recording errors are just some of the aspects that can cause response variations over time. The length of time between testings is crucial here as well. Short periods will be subject to bias from ‘remembering’ effects and longer periods will be subject to the fact that people will change if the time duration is long enough. It is possible that a change in scores does represent a legitimate change in the true score rather than random error. For example in the Team Management Profile Questionnaire constructs there is ample evidence that many people can move from a more introverted relationship preference at work to a more extroverted one, as they develop confidence in their ability to communicate.
Test-Retest of the Team Management Profile Questionnaire
A sample of 100 people were asked to complete the profile questionnaire over a time period of between one and six years. The breakdown of time intervals between administrations was:
- 1 year: 4 people
- 2 years: 39 people
- 3 years: 20 people
- 4 years: 23 people
- 5 years: 13 people
- 6 years: 1 person
The data were analysed and reported in two ways.
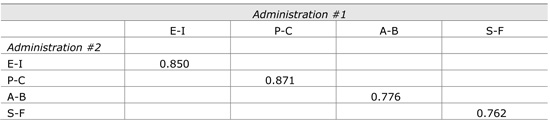
All correlations are above the acceptable level of 0.70–0.75.
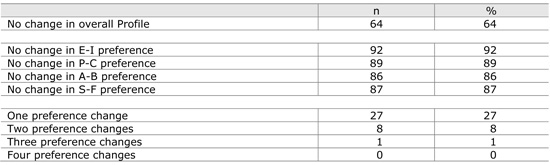
64% of respondents reported no change in their overall team role preference and a further 27% changed their scores across one of the work preference measures only. In other words, 91% of respondents had no change or only one change in the poles of the four work preference measures. From this, it is possible to conclude that the Team Management Profile gives excellent stability on an individual’s work preferences, certainly more than enough for it to be used reliably in personal and team development interventions. Table 1 also gives useful information on which of the work preferences are more likely to change over time. The data suggests that for the sample surveyed, respondents recorded a greater change on their Structured–Flexible (S–F) scores than any of the other three. From interviews with many participants in our worldwide programs it seems that this change is likely to be encouraged by many organisations. We have many examples of people starting off their careers with a ‘flexible’ score on the organisation work preference and then changing to be more structured as management development programs encourage them to work in a way that is planned, time sensitive and converges on desired outputs.
Key Insight: 91% of respondents showed no change or only one change in their four work preference measures over 1–6 years — demonstrating excellent temporal stability for the TMP.
The QO2
The QO2 – the Opportunities-Obstacles Quotient – is based on a fifth scale which measures different aspects from those defined by the Team Management Profile Questionnaire. Five subscales form the basis of the QO2 methodology and comprise the Risk-Orientation Model:

- MTG Energy – how much energy you put into ‘Moving Towards your Goals’.
- Multi-Pathways – the extent to which you find ways around obstacles.
- Fault-Finding – how good you are at seeing potential obstacles.
- Optimism – the extent to which you expect positive outcomes.
- Time-Focus – a measure of your psychological time and your orientation to the past, the present or the future.
Test-Retest of the QO2
A sample of 165 people was analysed with a time interval of re-administration ranging from one to over twelve months. The age range was 19–60 years with 46% men and 54% women. The test-retest correlation coefficients were 0.80 for the Opportunities items and 0.74 for the Obstacles items. While the Obstacles scale correlation coefficient is only just below the value of 0.75 we usually look for, it is perfectly adequate for a scale known to have some variation with time. The results showed:
- A quarter of the sample had a QO2 score variation of less than 9%.
- Half the sample showed a variation of less than 17%.
- Three-quarters had a variation of less than 30%.
Key Insight: The QO2 demonstrates solid test-retest reliability with correlation coefficients of 0.80 (Opportunities) and 0.74 (Obstacles) — confirming it as a dependable tool for measuring risk orientation over time.